The general operations we want to perform with distributions are
- Compute the probability/density at specific value of \(x\)
- Compute the probability of an interval, e.g. \(X \ge x\), \(a \le X \le b\), etc.
- Sample random numbers from that distribution
The main distributions we will use are the binomial and normal distribution.
A binomial distribution \(\operatorname{Bin}(n, p)\) is the model for: - flipping \(n\) coins where the probability of a heads is \(p\) - a multiple choice test where the probability of getting a question right is \(p\)
The probabilities for a binomial distribution is given by \[P(x\text{ successes}) = P(X = x) = {}_nC_x \cdot p^x \cdot q^{n - x}.\] We also write \(P(X = x \mid n, p)\) if we want to clarify what \(n\) and \(p\) are.
Example 1 For a multiple choice test where we have a \(75\%\) chance of getting a correct answer, the probability of getting \(8\) out of \(n = 10\) questions right is \[P(X = 8 \mid n = 10, p = 0.75) = {}_{10}C_8 \cdot 0.75^8 \cdot 0.25^2\] Where \[\begin{align*}
{}_{10}C_8 = \frac{{}_{10}P_8}{8!} &= \frac{10 \cdot 9 \cdots (\text{eight terms})}{8!} \\
&= \frac{10 \cdot 9 \cdot 8 \cdot 7 \cdot 6 \cdot 5 \cdot 4 \cdot 3}{8 \cdot 7 \cdot 6 \cdot 5 \cdot 4 \cdot 3 \cdot 2 \cdot 1} \\
&= \frac{10 \cdot 9}{2} = 45.
\end{align*}\]
Desmos
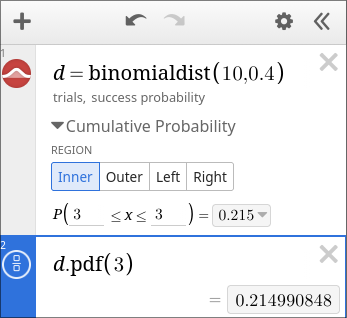
To define a binomial distribution in Desmos, we can either use the + menu > inference > probability distribution. Or we can type out “binomialdist(n, p)” with our values for \(n\) and \(p\).
To make it possible to refer to the distribution later, I like to write “d = binomialdist(n, p)”. Then we can write things like “mean(d)” for the mean/expected value of the distribution.
Specific values in Desmos
We have two options.
- We can use the \(d.\operatorname{pdf}(x)\) function.
- We can use the Cumulative Probability menu to compute \(P(x \le X \le x)\).
E.g. for \(x = 3\):
Interval probabilities in Desmos
We can use the Cumulative Probability menu to compute various probabilities:
- \(P(a \le X \le b)\): Inner
- \(P(X \le a)\) or \(P(X \ge b)\): Outer
- \(P(X \le a)\): Left
- \(P(X \ge b)\): Right
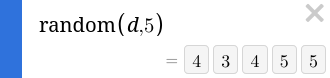
Random numbers in Desmos
Having defined “d = binomialdist(n, p)” we can generate random numbers with this distribution using “random(d)” or if we want multiple, we can add a number like “random(d, 5).”
Practice
- Use Desmos to compute the probability of getting \(5\) questions right in a quiz with \(7\) questions and a probability of success \(p = 0.85\).
- With \(X \sim \operatorname{Bin}(10, 0.7)\) compute The probability of getting between \(2\) and \(8\) successes: \(P(2 \le X \le 8)\)
- The probability of getting at least \(5\) successes: \(P(X \ge 5)\).
- The probability of getting less than \(5\) successes: \(P(X < 5)\).
R
In R the functions are:
dbinom(x, n, p) for \(P(X = x \mid n, p)\)pbinom(x, n, p) for \(P(X \le x \mid n, p)\)rbinom(k, n, p) to generate \(k\) random numbers
Specific values
E.g. to compute the probability of getting exactly \(5\) questions right out of \(7\) with \(p = 0.85\):
Intervals in R
In R the function for a left interval is pbinom(x, n, p) for \(P(X \le x \mid n, p)\). For other intervals, we might need to do some arithmetic. Such as:
\[
P(a \le X \le B) = P(X \le b \text{ and } X \not < a) = P(X \le b) - P(X \le a - 1)
\] The \(a - 1\) is because \(X < a\) is the same as \(X \le a - 1\).
E.g. if \(X \sim \operatorname{Bin}(10, 0.7)\) then
- \(P(2 \le X \le 8) = P(X \le 8) - P(X \le 1)\):
- \(P(x \ge 5) = 1 - P(X \le 4)\):
- \(P(X < 5) = P(X \le 4)\):
Random numbers in R
E.g. if we want to simulate taking a 10 question multiple choice test (with \(p = 0.7\)), 100 times, we can use rbinom(100, 10, 0.7):